What are customer experience metrics?
Customer experience can’t be measured directly, but keeping track of the factors related to it gives us a good proxy. Customer experience metrics are just that – measurable indicators of a good, or bad, customer experience. And whilst measurement is not the goal, it can, and should, be used to gauge the improvements you make to the experience over time.
Because customer experience is complex, it’s a good idea to keep track of a variety of metrics in order to make sense of its different dimensions. In this article we’ll round up the key CX metrics you need to know about.
Net promoter score (NPS®)
Want to know how loyal your customers are and how likely they are to recommend you and buy from you in future? The Net Promoter Score measures customer loyalty based on one simple survey question: ‘How likely is it that you would recommend [Organization X/Product Y/Service Z] to a friend or colleague?’
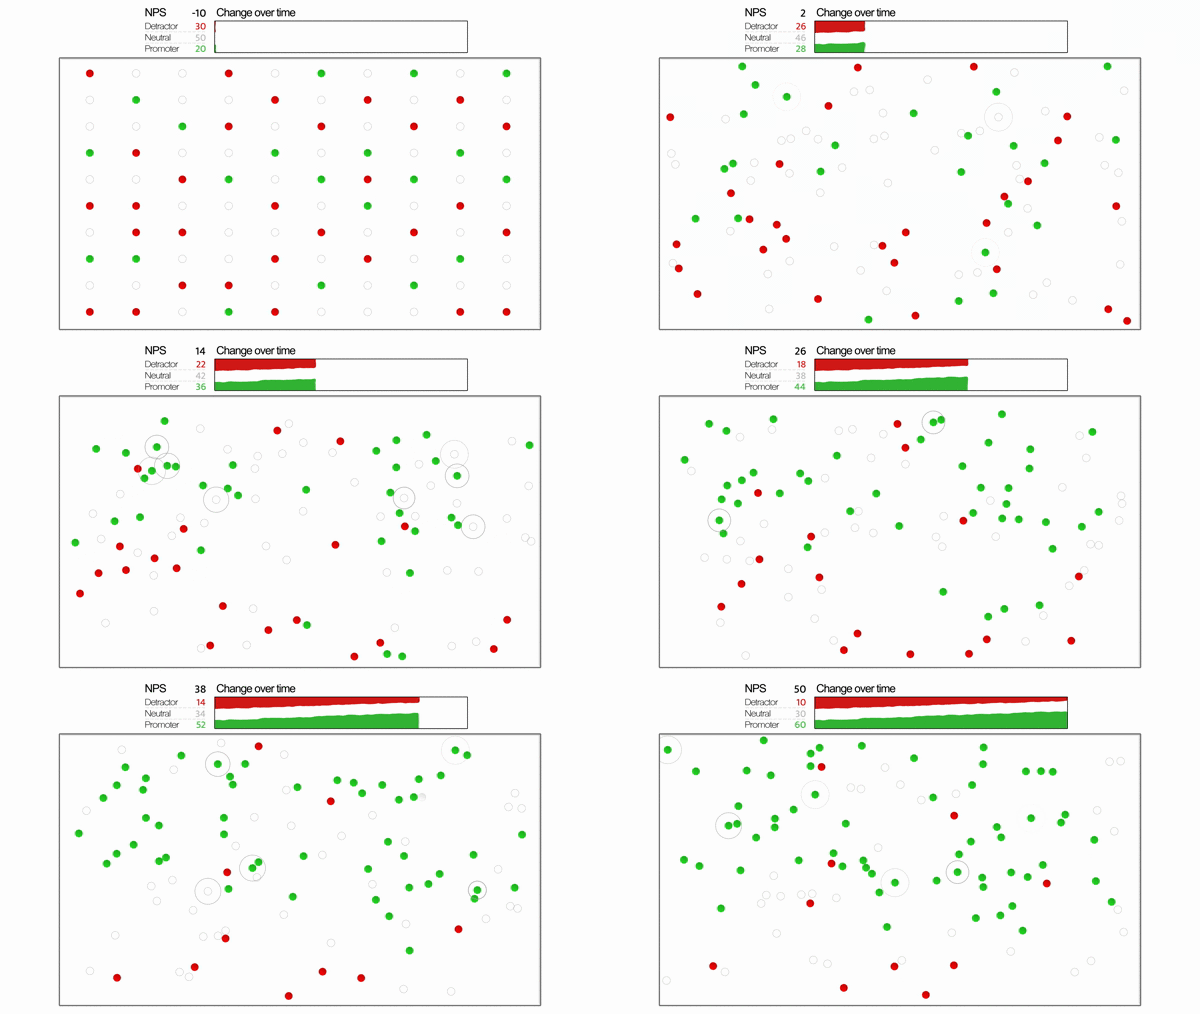
Respondents give a rating between 0 (not at all likely) and 10 (extremely likely). You then remove the neutral responses and subtract the percentage of Detractors, from the percentage of Promoters to give an NPS score.
NPS is the most common customer experience measurement – it’s easy to understand, quick to complete and gives a big-picture customer loyalty gauge.
Download our free NPS survey template now
See what happens when you improve your NPS with the simulation below.

Customer satisfaction (CSAT)
If you’re measuring CX, it makes sense to know how satisfied your customers are with your products or services. CSAT measures customer satisfaction based on a question: ‘How would you rate your overall satisfaction with the [goods/service] you received?’ Respondents use a rating scale between 1 (very unsatisfied) to 5 (very satisfied).
The two highest ratings (4 and 5 on the scale) are used to calculate a percentage score: 100% being total customer satisfaction and 0% total customer dissatisfaction. CSAT evolved from market research surveys, and is easy to understand, simple to use, and can be rich in insight.
Want to effortlessly launch a project to measure CSAT? Download our free template now
According to McKinsey, the benefits of measuring, and improving CSAT in the customer journey are clear for your business.

Customer effort score (CES)
You’ll want your customers to be able to interact with you as effortlessly as possible. Customer effort score (CES) asks a question like: ‘How easy was it to deal with our company today?’ giving simple options: Easy, Neither, Difficult. Subtract the percentage of ‘Difficult’ respondents from the ‘Easy’ ones to give the CES.
CES is relatively new compared to NPS or CSAT, but it’s easy to understand and use, and supplies actionable data so you can change things quickly. Increasing your CES score can also help impact positive reviews on the business.
Customer lifetime value (CLV)
Customer lifetime value is the sum total of how much money a customer has brought into your business over the entire relationship. It also takes into account costs associated with the customer, like the cost of acquisition and retention and the cost to serve them.
CLV relates to CX by giving you a measure of the longevity of the relationship, the amount of spend and frequency of purchase, and how that relationship has changed over time. It’s crucial because it helps you look at the customer experience as a customer journey, rather than single interactions.
High CLV is likely to go hand in hand with good experiences, after all there’s a reason why customers are staying loyal. While low or diminishing CLV can be a sign that something is lacking. CLV also helps you identify your most valuable customers so you can recognize and reward them.
Customer churn rate
Like CLV, customer churn rate is a big-picture metric that helps you understand how loyal your customers are. If you’re experiencing a high customer churn rate, that’s a sure sign that your customer experience isn’t doing enough to create loyalty and bring customers back for more.
Careful customer churn analysis can help you identify the warning signs when customers are at risk of churning and give you the opportunity to step in and find out how you can set things right.
Average response time
Tracking how long it takes for a customer query to be responded to is a useful O-data (operational data) metric. Are they waiting in a contact center queue for 20 minutes before someone answers them? Do they have to wait minutes for a response from your live chat operatives? What about when they try to get in touch via social media? If it’s too long, the chances are that their experience is not a good one.
Keeping track of average response times across all of your channels can be a useful hygiene-check for CX. You can try setting a threshold for maximum acceptable waiting times with an automatic alert to take action if these are exceeded.
Make sure that when the customer is responded to, the experience is a good one. Learn more about XMDirectory.
Average resolution time
Like average response time, this is an operational metric that provides an indicator of the customer experience by tracking how much of a customer’s time needs to be spent to resolve a support question or complaint. The less customer support time spent means more satisfied customers. The longer the time, the worse the experience is likely to be. And the more likely it is they won’t come back.
Other customer experience metrics
The list above provides some overall measures of satisfaction/sentiment/ease, but defining other more granular metrics allows you to dive deep into the areas that matter most for your business or where you can have the biggest impact. You might choose:
- Retention loyalty – how likely are you to remain with us?
- Purchase loyalty – how likely are you to continue buying from us?
- Meeting expectation – how much better (or worse) was your experience compared to your expectation?
Questions like these can be added into your customer feedback surveys to help gauge how the customer experience is performing for your business.
As well as feedback from your customers, you can also include operational data – things like website analytics, sales figures, and HR data – to make more links between what customers do and how they feel. Essentially, the more data points you have, the more opportunities you have to identify what works, what doesn’t and what you need to focus on to improve.
Original Research: ROI of customer experience in 2021
How do you choose which metrics to track?
As you can see, there are plenty of metrics out there and you could spend a lot of time watching them all. However, the choice of metrics is not as important as you might think – companies will not succeed or fail based on the metrics they choose.
Driving improvement is what’s important – and the metrics you choose are simply that, a score you can track to monitor your improvements.
With that in mind, choose metrics based on what you’ll be able to do with the data they provide. Are the results going to enable you to take action? If not, don’t spend time on them.
The next step – taking action
The most valuable metrics are actionable ones. For example, if you measure average response time, you can take action by improving staffing levels or software resources in your contact center, revising your ticketing system or offering better training to your people. This level of activity can be measured through customer experience KPI’s.
Your CX metrics should form part of a system of action, pointing the way towards the steps you’ll take to improve CX in your business. And when you do take action, make sure your customers are aware that the improvements you make came from their experiences and their feedback. That’s where real customer relationships and lasting loyalty are built.
eBook: 16 ways to capture and capitalize on customer insights